The Power of Numbers

Author: Aneesha Ugwoke (she/her)
In my first blog, I talk about my workplace culture that encourages safe and brave spaces. Here, vulnerable conversations created awareness and education through “desired discomfort”. However, anecdotal proclamations don’t solely reflect behavioral changes. One also needs data, scientific evidence of current state.

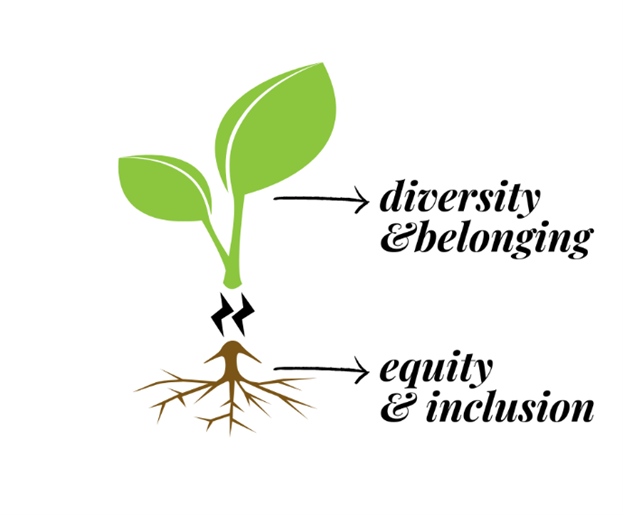
Believing that celebrating data focused only on your recruitment efforts into junior roles is an accomplishment is a misnomer. I’m not suggesting not to hire diverse employees into these jobs. I’m underscoring the importance of equity and inclusion as the focal point of your efforts to produce diversity and sense of belonging as inevitable outcomes at ALL levels of the organization. Because here’s the thing: what separates the company who is “tick-boxing” their DEI efforts from the one who is leading it is the ‘what, why, where, who, when, and how’ they pull their data.
Okay, multiple choice question time. Which statement is true?
A) Sound decisions are data driven. If I don’t know where I am, I won’t know where I’m going.
B) Poor decisions are data driven. Data doesn’t give me the right answers to all my problems.
You need to know where you are to select the right path forward. And measuring DEI is a balance of both qualitative and quantitative data to be effective. So, both statements are true.
However, sound decisions come from meaningful data.
“Meaningful data: data that explores the whole truth and seeks to transform the system”.
We see ways to translate good intentions into systemic equity as a three-pronged approach:
A) Attraction
- Ubiquitous to others, we know that senior and executive leadership look homogenous. We have a goal that transparently addresses the gap so that we have meaningful outcomes by 2025.
- Data that measures the success rates from various targeted sources including BIPOC communities and institutions.
- Data that unveils IF a self-identifying diverse individual was considered and WHY they were not hired, as applicable.
- A dashboard that publicly displays our current state and our goals.
- Hopes for the future:
- Leader-led annual reports that showcase their own hiring results. Broken down by division, business unit, and the manager could really be the visual aid that catalyzes ownership and any necessary support.
B) Retention
- Augment internal movement analytics with turnover stats.
- Track mentees and formalized individual development plans so that there is awareness outside of the individual’s business unit.
- Build internal mobility into the overall dashboard and compare data to last fiscal to reflect and project.
- Analyze all existing pay disparities.
- Hopes for the future:
- Talent map to fill gaps, project, and plan. The plan includes succession opportunities, coaching opportunities, and accountability.
- Utilize statistical data to draw conclusions. An example of that would be that your data reporting uncovers an employee who has applied to numerous roles and failed. This is a gift to dig deeper into the why and provide needed support accordingly.
C) Engagement
- As an organization, you already have objectives that measure employee experiences through various engagement drivers. Augment this by setting a belonging index where value is expressed directly from underserved employees.
- Because results from survey scores
- don’t give the ‘why’
- can present results that don’t capture feelings of the entire underrepresented population in the organization
- supplement the data with focus group discussions and ad hoc surveys that ask intentional questions to get more chunks of the entire picture.
- Hopes for the future:
- Even though surveys are developed based on industry best practices, the composition of the industry is still dominated by privileged individuals. Think about how to use your marginalized employees as collaborators. Perhaps they can provide feedback on the questions being asked about their own engagement to create a truly decolonized survey.
The most important takeaway is that measuring data on the organization’s DEI maturity is an iterative effort over time. That’s both good news and cause for caution. The aging process gives hope and ensures that there’s thought and quality in the execution. Conversely, time can also pave the way for competing priorities to eclipse continuous traction on DEI percolation. To combat this, continuous consultation support from a third party could help.
In conclusion, there IS power in numbers. It’s not the only crutch to aid in decision-making but it’s an integral one.
With pure intention, continuous curiosity, and fact checking with data we aspire to do better and be better.
About the Author: Aneesha Ugwoke (she/her) is currently a leader with Farm Credit Canada, CPHR Alberta member, and an anti-racism specialist.
The views and opinions expressed in this blog post belong solely to the original author(s) and do not necessarily represent the views and opinions of CPHR Alberta.
The views and opinions expressed in this blog post belong solely to the original author(s) and do not necessarily represent the views and opinions of CPHR Alberta.


